

For coverage of Medicare benefits, people face a choice between traditional Medicare and private Medicare Advantage plans. While there are many distinguishing features between these coverage types, one key benefit of Medicare Advantage is an annual cap on out-of-pocket costs for medical benefits, which traditional Medicare does not include. In 2026, the out-of-pocket limit for Medicare Advantage plans may not exceed $9,250 for in-network services and $13,900 for a combination of in-network and out-of-network services, but plans can have lower out-of-pocket limits than the maximum.
Policymakers have long considered whether to add a similar out-of-pocket cap in traditional Medicare. In 1988, Congress enacted a Medicare out-of-pocket cap, but the law was repealed one year later principally due to concerns about the financing mechanism. The Medicare Payment Advisory Commission (MedPAC) has recommended changes in traditional Medicare to give beneficiaries better protection against high out-of-pocket spending, including an out-of-pocket cap as part of a broader redesign that also includes combining Part A and Part B deductibles and simplifying cost sharing. Traditional Medicare remains the only major form of health insurance that does not include a cap on out-of-pocket spending, though most beneficiaries in traditional Medicare have additional financial protection through supplemental coverage, including Medicaid, employer- or union-sponsored retiree coverage, or a Medigap policy (which may require additional premiums).
This brief analyzes out-of-pocket limits in Medicare Advantage plans in 2026, variation by plan type, the distribution of enrollees facing different out-of-pocket limits, and trends over time. Of note, this analysis does not show the share of enrollees that reach their plan’s out-of-pocket limit in any year because spending data are not available. The analysis includes Medicare Advantage plans generally available for individual enrollment, reflecting coverage for 21.3 million Medicare beneficiaries in 2026, excluding special needs plans and employer-and union-sponsored group plans (See Methods for details).
Takeaways
- In 2026, the average enrollment-weighted out-of-pocket limit for Medicare Advantage enrollees is $5,421 for in-network services and $9,825 for in-network and out-of-network services combined. The average out-of-pocket limit for in-network services is higher for preferred provider organizations (PPOs) ($6,592) than health maintenance organizations (HMOs) ($4,636).
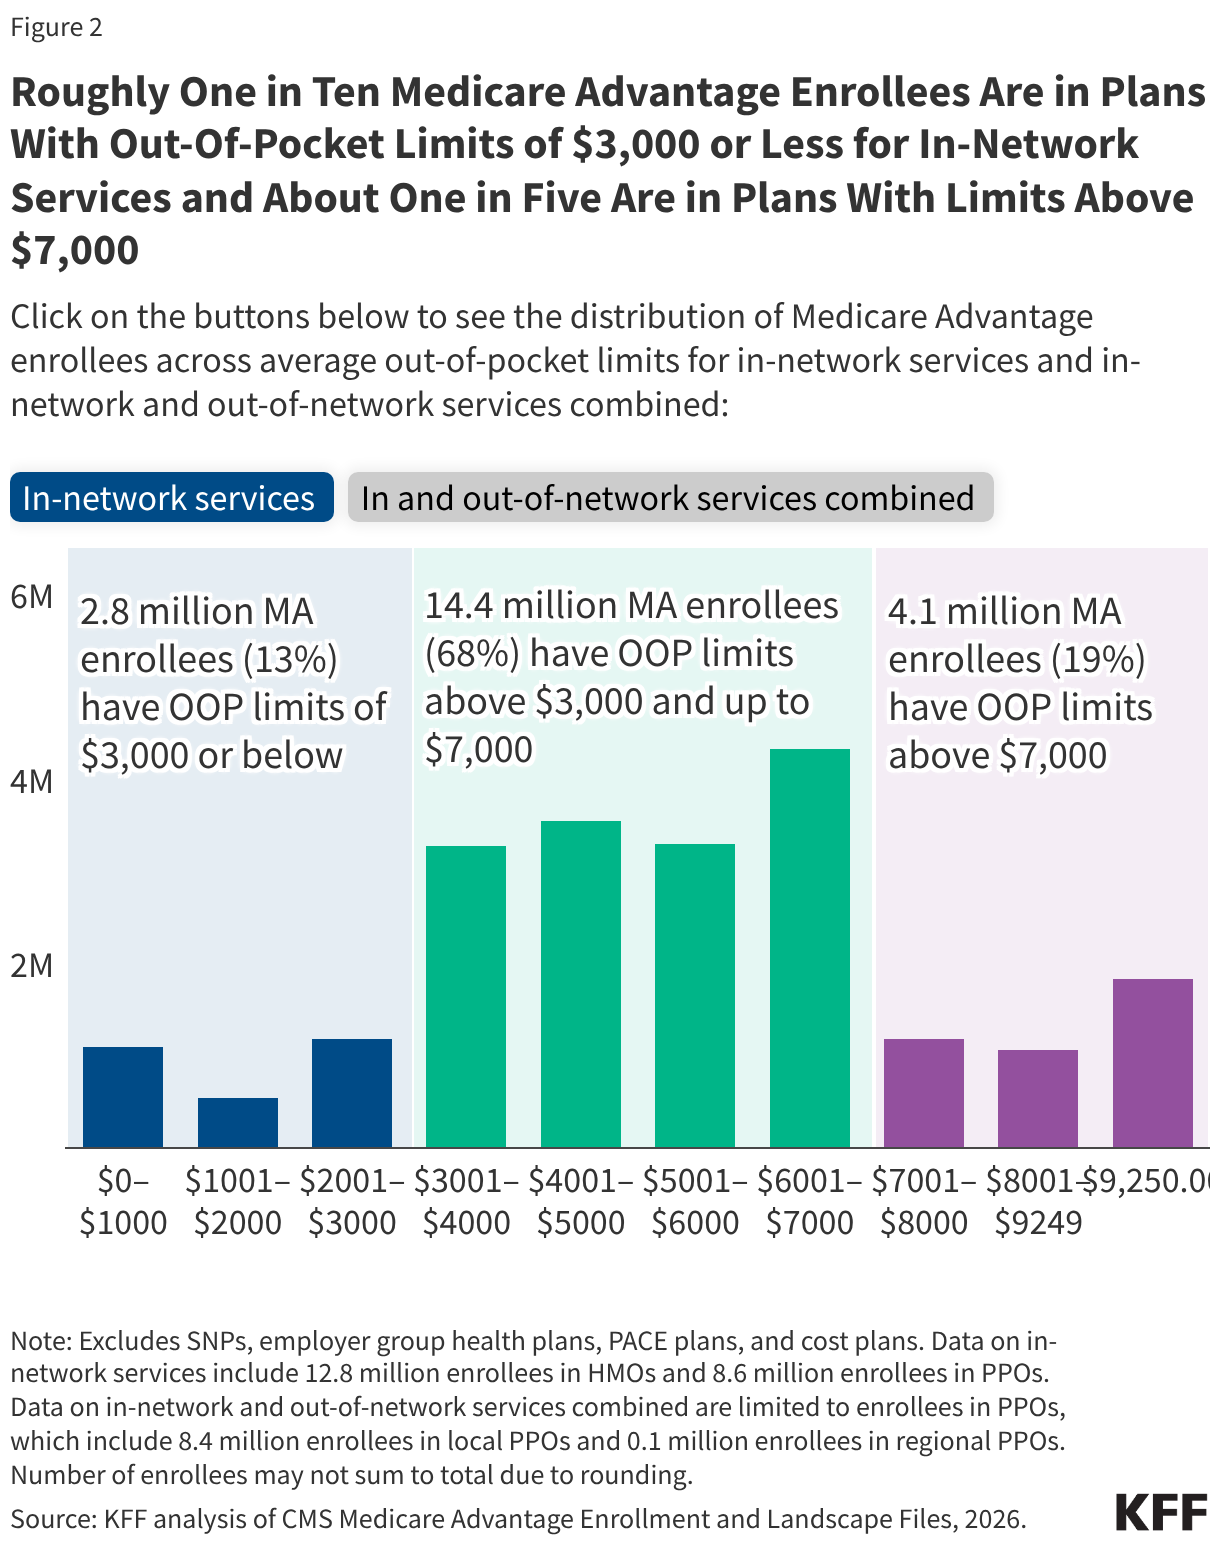
- Just over one in ten Medicare Advantage enrollees (13% or 2.8 million people) are in plans with limits of $3,000 or less for in-network services in 2026, more than two-thirds (68%) are in plans with limits above $3,000 and up to $7,000, and about one in five (19%) are in plans with limits above $7,000.
- About one in 10 (9%; 1.8 million) Medicare Advantage enrollees are in plans with the maximum out-of-pocket limit for in-network services ($9,250). Among the 8.6 million enrollees in PPOs, roughly one in five (22%; 1.8 million) are in plans with the maximum out-of-pocket limit for in-and out-of-network services combined ($13,900).
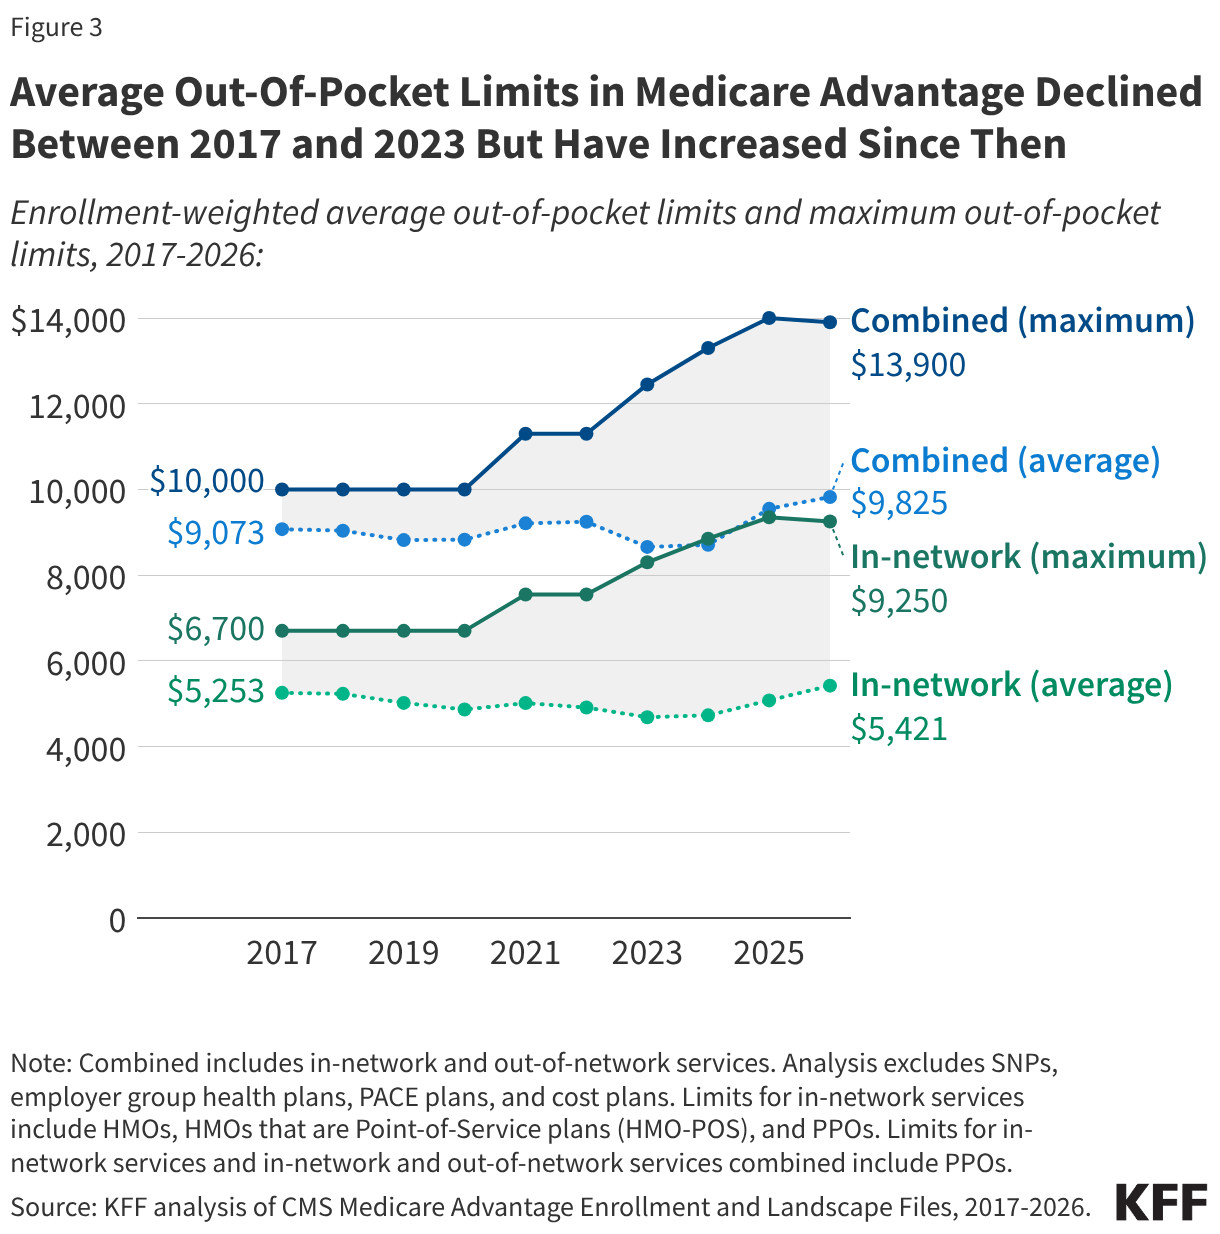
- The average out-of-pocket limit for in-network services decreased by nearly $600 from 2017 to 2023 ($5,253 to $4,685), before increasing by about $700 from 2023 to 2026 ($4,685 to $5,421).
In 2026, the Average Enrollment-Weighted Out-of-Pocket Limit for Medicare Advantage Enrollees Is Lower for HMOs Than PPOs
The average out-of-pocket limit faced by Medicare Advantage enrollees in 2026 is $5,421 for in-network services and $9,825 for in-network and out-of-network services combined (Figure 1). These averages are lower than the maximum allowable out-of-pocket limits ($9,250 and $13,900, respectively).
Differences in out-of-pocket limits may reflect how Medicare Advantage plans choose to allocate rebate dollars, which are extra payments they receive from the federal government beyond the cost of providing Part A and Part B services. Plans may use rebates to reduce beneficiary cost sharing, including lowering out-of-pocket limits, but they can also use these funds for other purposes, such as offering supplemental benefits not covered by traditional Medicare, offering a rebate against the Part B premium, or lowering Part D premiums.
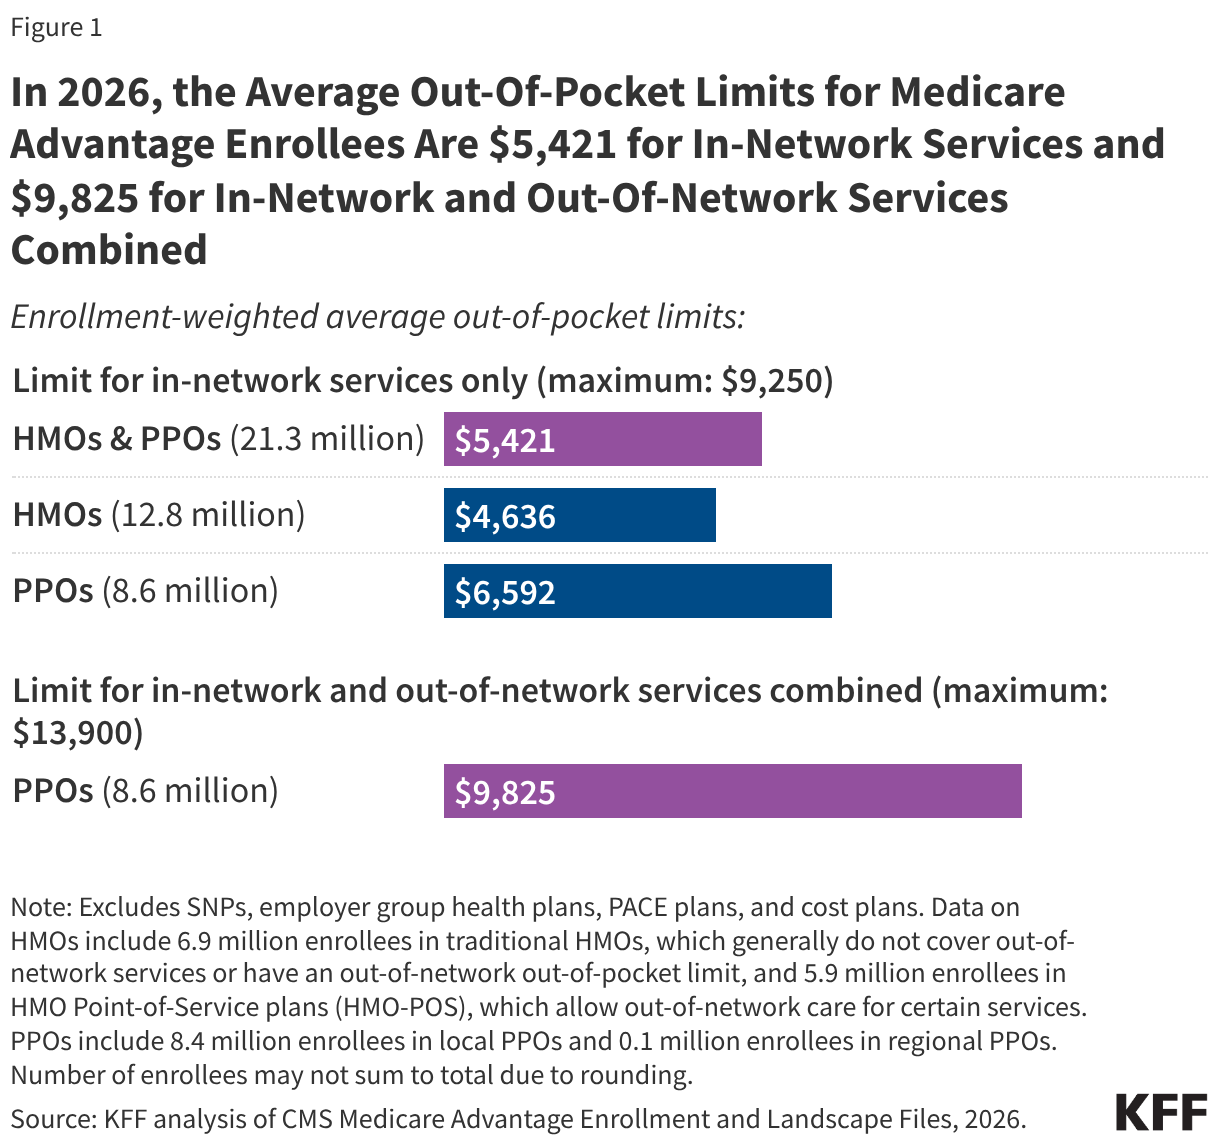
Out-of-pocket limits for in-network services vary by plan type. HMOs, which have 12.8 million Medicare Advantage enrollees in 2026, generally offer no coverage of services from out-of-network providers, but offer a lower out-of-pocket limit for in-network services than PPOs. PPOs, which have 8.6 million enrollees in 2026, cover services delivered by in-network and out-of-network providers, but require higher cost sharing for out-of-network providers. While PPO enrollees have broader access to out-of-network providers than HMO enrollees, they also face a higher out-of-pocket limit, even for in-network services. Specifically, the average enrollment-weighted out-of-pocket limit for in-network services is $6,592 for PPOs and $4,636 for HMOs.
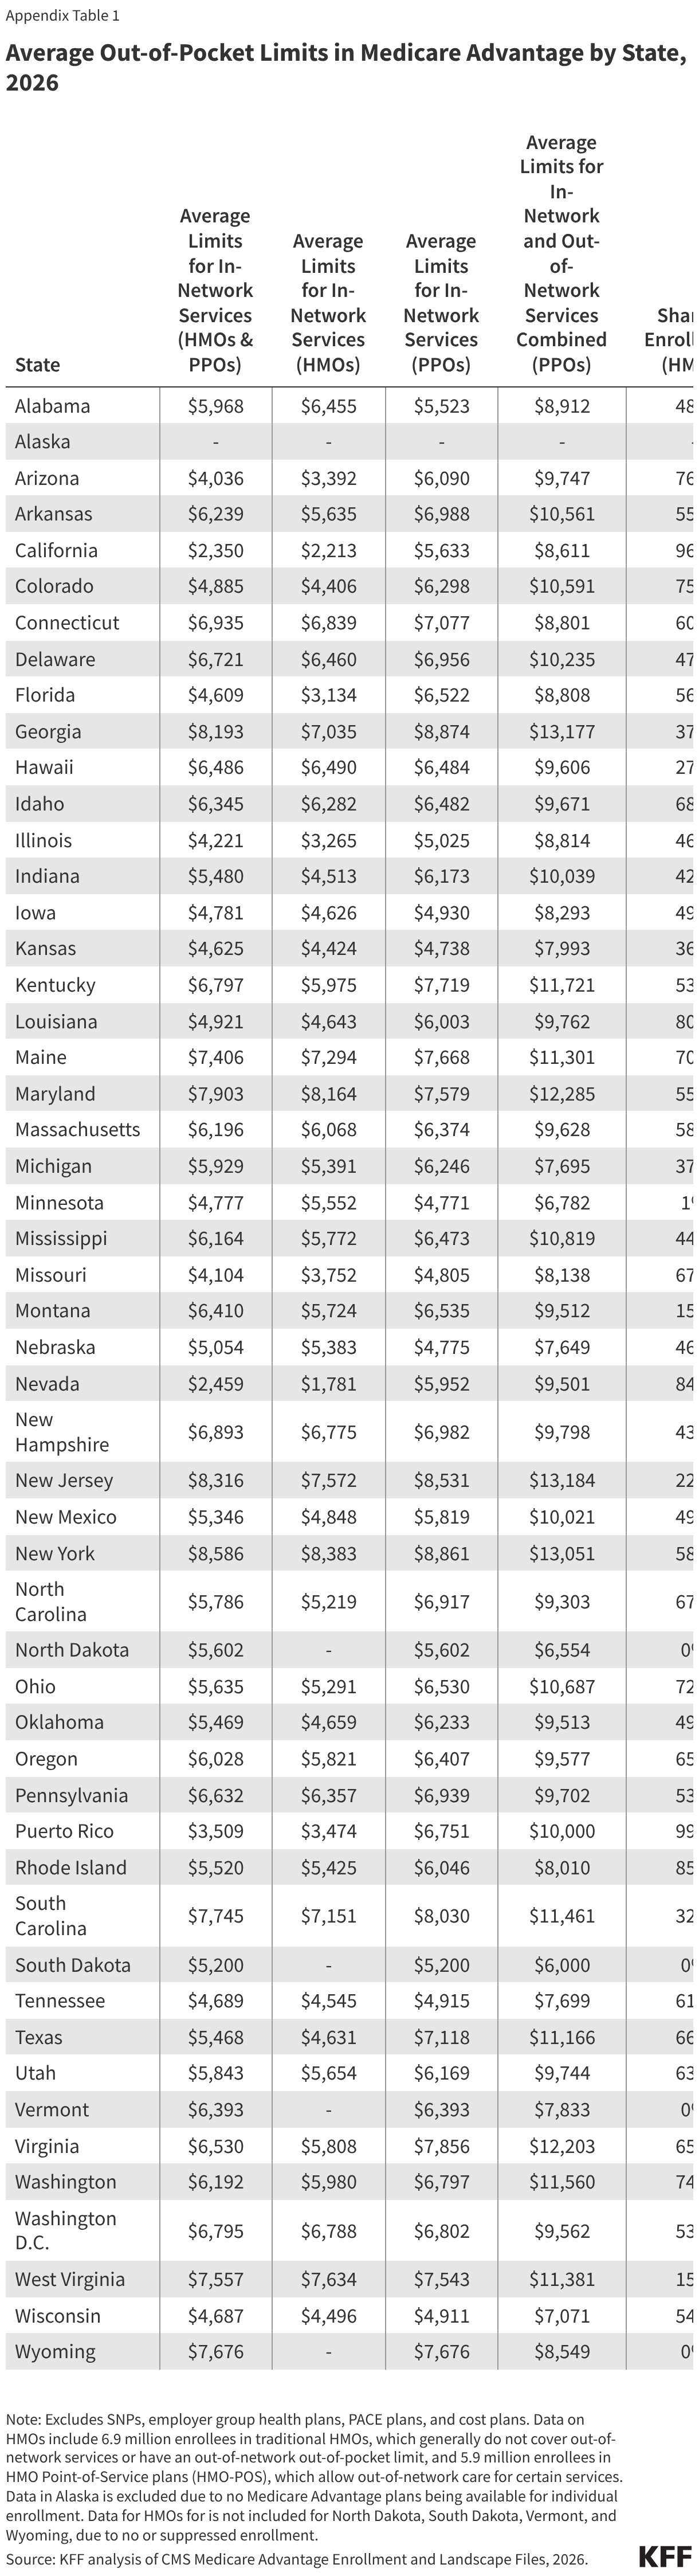
The distribution of enrollment between HMOs and PPOs, as well as the average out-of-pocket caps for in-network services by type of plan, vary across states (Appendix Table 1). Due in part to PPOs (which have higher average in-network out-of-pocket limits than HMOs) comprising a larger share of enrollment in rural areas, the average out-of-pocket cap is about $800 higher for Medicare Advantage enrollees in rural areas than in urban areas ($6,078 vs $5,291).
In 2026, Roughly One in Ten Medicare Advantage Enrollees Are in Plans With Limits of $3,000 or Less for In-Network Services and About One in Five Are in Plans With Limits Above $7,000
Among all Medicare Advantage enrollees in individual plans, just over one in ten (13%, 2.8 million) are in plans with out-of-pocket limits of $3,000 or less for in-network services (Figure 2). Nearly all of these enrollees (99%) are in an HMO. More than two-thirds (68%, 14.4 million) of Medicare Advantage enrollees are in plans with out-of-pocket limits above $3,000 and up to $7,000. About one in five (19%, 4.1 million) are in plans with limits above $7,000, including 1.8 million enrollees who are in a plan with the maximum in-network out-of-pocket limit of $9,250. PPOs enrollees account for the majority of these enrollees at the maximum cap (66%).
Among the 8.6 million Medicare Advantage enrollees in PPOs, about one in ten (9%) have a combined limit for in-network and out-of-network services at or below $6,000. More than two-thirds (66%; 5.7 million) of enrollees are in plans with a combined limit for in-network and out-of-network services between $6,000 and $12,000. One quarter (25%; 2.1 million) are in plans with an out-of-pocket limit for in-and out-of-network services combined above $12,000, including 1.8 million enrollees in plans with the maximum out-of-pocket limit for in-and out-of-network services combined ($13,900) (Figure 2).
Average Out-of-Pocket Limits for In-Network Services Generally Declined Between 2017 and 2023 but Have Increased Since Then
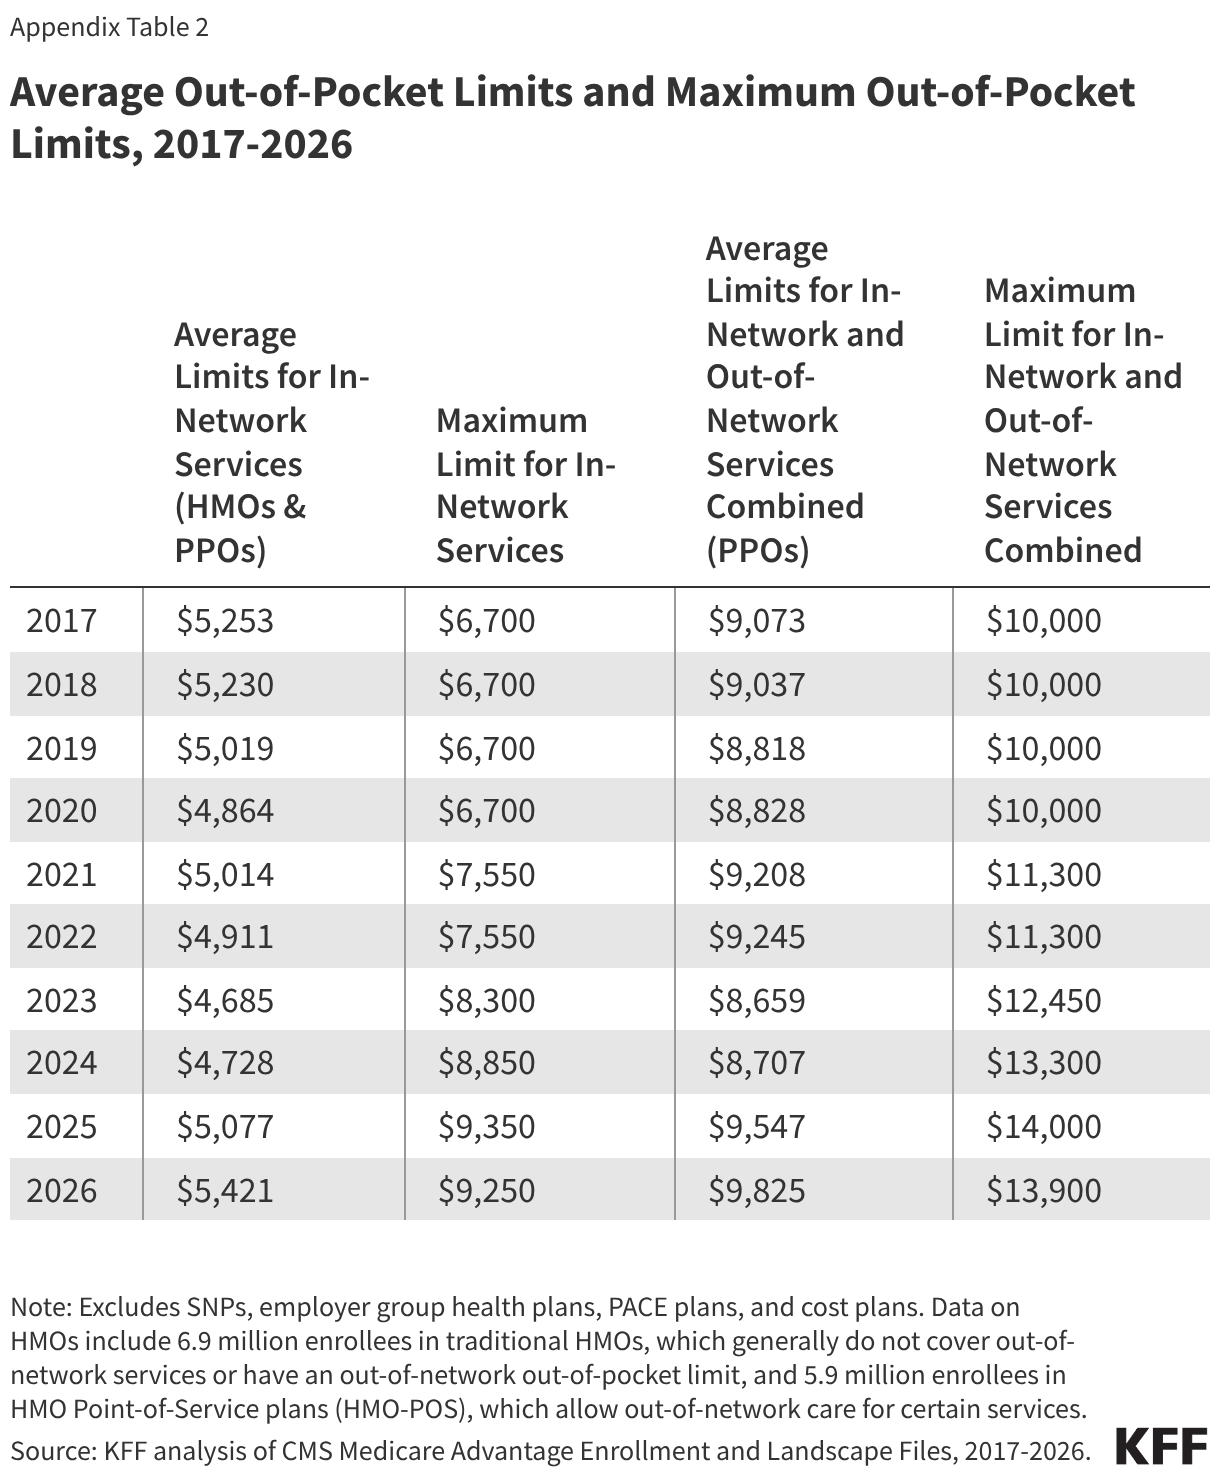
The average limit for in-network services decreased by nearly $600 from 2017 ($5,253) to 2023 ($4,685), before increasing by about $700 from 2023 to 2026 ($5,421) (Figure 3, Appendix Table 2). The average limit for in-network and out-of-network services combined has fluctuated over time but increased overall by about $750 between 2017 ($9,073) and 2026 ($9,825).
The maximum allowable out-of-pocket cap has generally increased over time, consistent with projected beneficiary out-of-pocket spending in traditional Medicare, which CMS uses to calculate maximum out-of-pocket limits in Medicare Advantage. However, the maximum cap decreased by $100 between 2025 and 2026. The average out-of-pocket limit faced by enrollees each year has always been lower than the maximum allowable limit. This gap has generally widened over time, but shrank somewhat between 2025 and 2026.
Methods
This analysis uses data from the Centers for Medicare & Medicaid Services (CMS) Medicare Advantage Enrollment, Benefit and Landscape files for 2017-2026. The analysis excludes Special Needs Plans (SNPs), employer- and union-sponsored plans, PACE plans, and cost plans. These plans serve distinct populations and some may have different enrollment requirements than Medicare Advantage plans (e.g., may be available to beneficiaries with only Part B coverage) and in some cases, may be paid differently than Medicare Advantage plans, limiting comparability with individual Medicare Advantage plans for general enrollment. These exclusions are reflected in both current data as well as data displayed trending back to 2017.
The total number of enrollees in individual Medicare Advantage plans in this brief (21.3 million) may be slightly different than the number reported in other KFF briefs because this analysis further excludes a small number of plans without an in-network out-of-pocket amount specified in the plan benefits files.
The average for PPOs in this analysis includes two types of plans: local PPOs, which cover individual or multiple counties, and regional PPOs, which cover an entire state or multiple states. The average for HMOs includes two types of plans: HMOs that primarily cover services provided by in-network providers only and therefore do not have a limit for out-of-network services, and HMOs that are Point-of-Service plans (HMO-POS), which allow out-of-network care for certain services but typically charge higher cost sharing than for in-network services.
In previous years, KFF’s analysis of average out-of-pocket limits in Medicare Advantage excluded HMO-POS because they represented a relatively small share of HMO enrollment at the time (e.g., 10% in 2017). However, HMO-POS enrollment has grown substantially and now accounts for nearly half (46%) of HMO enrollment in Medicare Advantage. As a result, these plans are included in the current analysis to better reflect the experience of a substantial share of Medicare Advantage enrollees in HMOs.
This analysis determines urban and rural analysis based on the 2024 Urban Influence Codes (UIC) published by the U.S. Department of Agriculture (USDA) Economic Research Service. See Methods of KFF, “Key Facts About Medicare Beneficiaries in Rural Areas” (June 2025) for more details. Connecticut is excluded from the analysis by rurality because of differences in FIPS codes in the CMS Medicare Advantage data and the USDA 2024 UIC.
Appendix Tables